안녕하세요, 넷마블 TPM실 기술분석팀 추숙입니다.
이전 글에서 Heaptrack에 대해 간략히 살펴보고, 수집기와 분석기를 설치했었습니다. 이제 설치를 마친 Heaptrack 수집기와 GUI 분석기를 사용하는 방법을 살펴보겠습니다.
Heaptrack 사용
수집기
Heaptrack 수집기에는 몇 가지 특징이 있습니다.
- 구동 중인 프로세스를 후킹할 수 있음.
즉, 워밍업(Warming up) 이후에도 프로파일링을 할 수 있음. - 시작부터 프로파일링도 할 수 있음.
- 수집한 데이터는 일정 주기로 압축함.
- 수집 중간에 결과를 분석해야 하는 경우, 수집기를 종료하지 않고 수집한 데이터를 복사할 수 있음.
- 수집 시에는 성능이 일부 하락할 수 있음.
- 수집 파일 형식은 ‘heaptrack.{process 명}.{pid}.gz’
(heaptrack을 실행한 디렉터리에 생성됨)
Heaptrack 수집기는 워밍업 이후에도 프로파일링을 할 수 있다는 특징이 있어서, 수집 방법은 크게 처음부터 수집하는 방법과 중간에 후킹하는 방법으로 나눌 수 있습니다.
처음부터 수집하기
처음부터 수집하려면 ‘heaptrack {process 명}’을 입력하면 됩니다.
[test@sqta-test01 leak_test]$ heaptrack ./main
heaptrack output will be written to "/home/test/test/leak_test/heaptrack.main.7660.gz"
starting application, this might take some time...

### 프로세스 종료 시, 아래와 같이 요약이 출력됨
heaptrack stats:
        allocations:            476
        leaked allocations:     358
        temporary allocations:  116
Heaptrack finished! Now run the following to investigate the data:
  heaptrack --analyze "/home/test/test/leak_test/heaptrack.main.7660.gz"
중간에 후킹해 수집하기
중간에 후킹해서 수집하려면, ‘heaptrack -p {process PID}’를 입력하면 됩니다.
[test@sqta-test01 leak_test]$ ps -aux |grep main |grep -v grep
test  7856  0.0  0.0  88560  1100 pts/0    Sl+  19:18   0:00 ./main
[test@sqta-test01 leak_test]$ heaptrack -p 7856

heaptrack output will be written to "/home/test/test/leak_test/heaptrack.main.8311.gz"
injecting heaptrack into application via GDB, this might take some time...
injection finished

### 수집 종료 시, 아래와 같이 요약이 출력됨. 수집 종료는 Ctrl + c
removing heaptrack injection via GDB, this might take some time...
heaptrack stats:
        allocations:        	1770
        leaked allocations: 	1328
        temporary allocations:  442
Heaptrack finished! Now run the following to investigate the data:
  heaptrack --analyze "/home/test/test/leak_test/heaptrack.main.8311.gz"
간단히 콘솔로 결과 보기
분석기를 실행하지 않아도, 콘솔에서 GUI 없이 간단히 결과를 확인할 수 있습니다. 위에서 수집한 데이터가 들어 있는 압축 파일을 ‘heaptrack_print heaptrack.{process 명}.{pid}.gz’로 열어서 볼 수 있습니다.
[test@sqta-test01 leak_test]$ heaptrack_print heaptrack.main.8311.gz
reading file "heaptrack.main.8311.gz" - please wait, this might take some time...
Debuggee command was: ./main
finished reading file, now analyzing data:

MOST CALLS TO ALLOCATION FUNCTIONS
885 calls to allocation functions with 14.18KB peak consumption from
main
  in /home/test/test/leak_test/main
443 calls with 14.18KB peak consumption from:
442 calls with 0B peak consumption from:

885 calls to allocation functions with 56.64KB peak consumption from
std::thread::_State_impl<>::_M_run()
  in /home/test/test/leak_test/main
885 calls with 56.64KB peak consumption from:
    execute_native_thread_routine
      in /home/test/test/leak_test/main
    start_thread
      in /lib64/libpthread.so.0
    __clone
      in /lib64/libc.so.6

PEAK MEMORY CONSUMERS
56.64KB peak memory consumed over 885 calls from
std::thread::_State_impl<>::_M_run()
  in /home/test/test/leak_test/main
56.64KB consumed over 885 calls from:
    execute_native_thread_routine
      in /home/test/test/leak_test/main
    start_thread
      in /lib64/libpthread.so.0
    __clone
      in /lib64/libc.so.6

14.18KB peak memory consumed over 885 calls from
main
  in /home/test/test/leak_test/main
14.18KB consumed over 443 calls from:

MOST TEMPORARY ALLOCATIONS
442 temporary allocations of 885 allocations in total (49.94%) from
main
  in /home/test/test/leak_test/main
442 temporary allocations of 442 allocations in total (100.00%) from:

total runtime: 88.68s.
calls to allocation functions: 1770 (19/s)
temporary memory allocations: 442 (4/s)
peak heap memory consumption: 70.82KB
peak RSS (including heaptrack overhead): 2.25MB
total memory leaked: 70.82KB
GUI 분석기
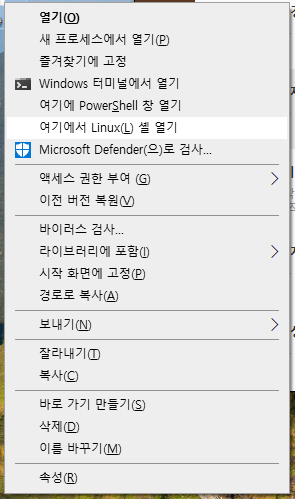
GUI 환경에서 동작하는 분석기는 WSL로 설치한 리눅스 셸에서 실행해야 합니다. 리눅스 안에서 파일을 찾아 이동하는 건 번거로울 수 있으니, 수집 파일이 들어 있는 폴더 위에서 ‘Shift + 우클릭’을 누르면 ‘여기에서 Linux 셸 열기’로 바로 들어가는 방법을 추천합니다.
수집한 파일을 인자로 ‘heaptrack_gui heaptrack.{process 명}.{pid}.gz’를 실행하면 됩니다. 단, 최초 설치 후에 실행하면 아래와 같은 에러를 마주하게 됩니다.
test@NM-P2103013:/mnt/c/Users/Desktop$ heaptrack_gui heaptrack.main.13907.gz
qt.qpa.xcb: could not connect to display :0
qt.qpa.plugin: Could not load the Qt platform plugin "xcb" in "" even though it was found.
This application failed to start because no Qt platform plugin could be initialized. Reinstalling the application may fix this problem.

Available platform plugins are: eglfs, linuxfb, minimal, minimalegl, offscreen, vnc, wayland-egl, wayland, wayland-xcomposite-egl, wayland-xcomposite-glx, xcb.

Aborted (core dumped)
이는 리눅스 셸이 UI를 출력할 윈도우 터미널을 찾지 못해서 발생한 에러입니다. 윈도우 UI로 터미널을 지정하면 해소할 수 있습니다. 먼저 ‘.hashrc’를 변경합니다.
$ echo "export DISPLAY=:0" >> ~/.bashrc
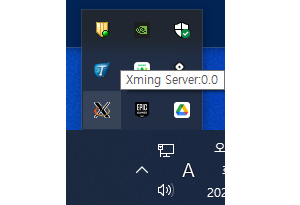
$ source ~/.bashrc그리고 Xming 유틸리티를 설치(소스포지 링크)합니다. Xming은 리눅스가 윈도우UI로 통신하게 지원하는 중계기 같은 역할을 합니다. Xming 설치를 마치고, 실행하면 트레이 아이콘을 볼 수 있습니다.
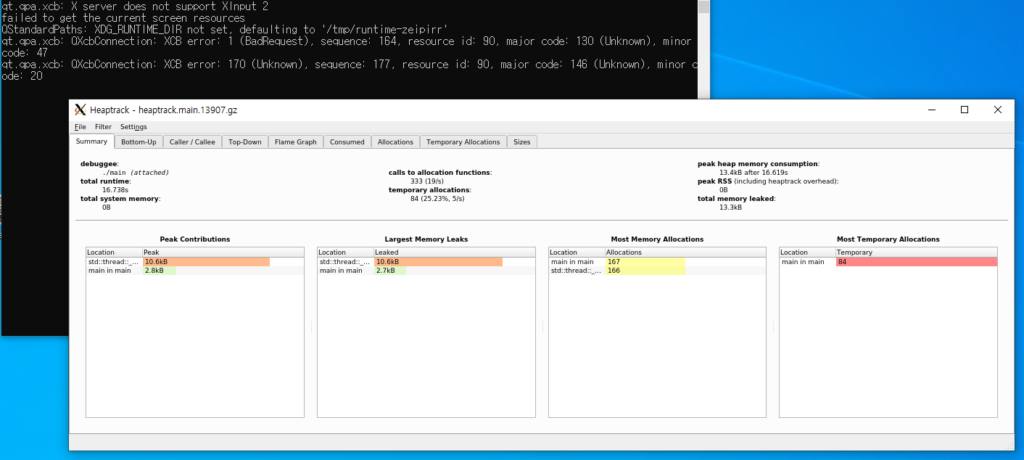
다시 ‘heaptrack_gui heaptrack.{process 명}.{pid}.gz’를 실행하면 아래와 같은 UI를 볼 수 있습니다. 단, 수집 데이터 사이즈에 따라 애플리케이션 로딩 시간이 오래 걸릴 수 있으니, 화면이 바로 뜨지 않더라도 잠시 기다려보는 것이 좋습니다.
버그도 있다
Heaptrack 설치와 간단한 사용 방법을 모두 마쳤습니다. 수집기와 분석기를 설치하고 실행하는 사이에 살짝 언급했던 내용처럼, 몇몇 버그도 볼 수 있습니다. 특히 분석기에서 사용률 순 정렬(Top Usage Sort&View) 기능을 쓸 때 메모리 사용량이 감소하면서 집계되는 음수 값이 정렬 순서에서는 절댓값으로 정렬되는 문제가 있으므로 조심해서 살펴봐야 합니다. 성능 향상을 위해 설치하는 ‘Zstd’는 리눅스 환경에 설치한 수집기 데이터를 윈도우 환경에 설치한 분석기로 연결한 경우에 제대로 동작하지 않아 성능 향상을 체감하지 못하기도 합니다.
하지만 리눅스에서 쓸 수 있는 다른 툴 대비 높은 편의성이 이런 버그로 인한 불편함을 충분히 상쇄시켜준다고 생각합니다. 리눅스 서버에서 발생하는 메모리릭을 찾을 때 도움이 되셨으면 좋겠습니다.
<관련 레퍼런스>
- 공식 프로젝트 저장소: https://github.com/KDE/heaptrack
- 의존성 라이브러리 설치 레퍼런스: https://userbase.kde.org/Heaptrack/Build/Ubuntu_16.04